Show summary Hide summary
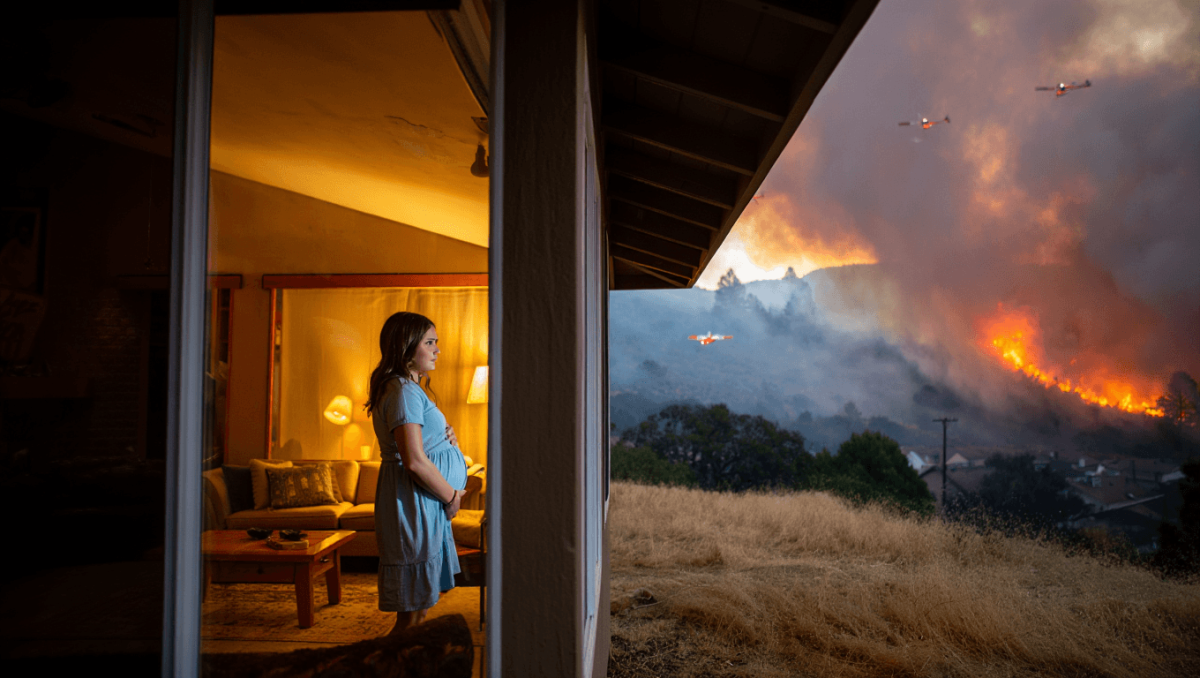
A San Luis Obispo resident who was days from giving birth watched smoke and retardant planes from her doorstep during the Lizzie Fire in October 2023 — a vivid reminder that wildfires now come to the edges of towns, not just remote forests. That same event has taken on new urgency as Cal Poly researchers and local fire agencies turn to a tabletop simulator to recreate fires, train responders and explain recently updated risk maps that affect homeowners across the county.
What the simulator shows — and why it matters
Cal Poly’s Wildland-Urban Interface Fire Institute began work in 2021 to study how wildfires behave where homes meet wildland. At the center of its outreach is a large tabletop device known as the Simtable, which projects a topographic map onto a tray of sand or crushed walnut shell to recreate hills, gullies and other terrain features.
The machine overlays satellite-derived fuel maps and lets operators alter wind, humidity and ignition points. From that platform, instructors can speed up time, launch simulated airtanker drops, route hose lines or place crews — then watch how those choices change the fire’s path. For local residents and city leaders, the visualizations make abstract zoning colors and technical risk categories easier to understand.
OKConnect unveils platform to help business leaders strengthen community bonds
Azerbaijan jails nine journalists and activists: rights groups warn of new press crackdown
How it works, in practical terms
| Function | How it helps | Typical users |
|---|---|---|
| Topography modeling | Recreates slopes and valleys that influence fire spread | Researchers, planners |
| Fuel-map overlay | Shows vegetation types that accelerate or slow fire | Firefighters, land managers |
| Tactical simulation | Tests suppression tactics and their consequences in minutes | Fire crews, incident commanders |
| Public demonstration | Translates technical risk zones into visible scenarios | Homeowners, elected officials |
From lab to front line
At a recent open house hosted by the San Luis Obispo Fire Department, residents watched a replay of the Lizzie Fire from overhead — an angle that, for some, triggered memories of the day smoke rolled across their yards. Those live demos are part of a broader push by the institute, CAL FIRE and local stations to use modeling tools in both training and community education.
Students support the operation and upkeep of the Simtable. One student technician described having to reverse-engineer the unit when the initial documentation proved inadequate for a campus program; that work included tailoring instructions so the simulator can be used reliably despite regular staff turnover.
Training scenarios and real-world lessons
For firefighters, the table offers a low-cost environment to test decisions that would be costly or dangerous in the field. Simulated airdrops, bulldozer lines and hand-crew deployments reveal how timing and placement alter outcomes — and where small choices can cascade into larger failures.
- Faster learning: Teams can observe results of tactics in minutes rather than days.
- Risk communication: Visuals help residents understand why specific parcels fall into higher-severity zones.
- Planning support: Planners can prioritize fuel treatments and evacuation routes based on modeled behavior.
Context: a changing wildfire landscape
State data show a marked increase in destructive fires in recent years, and local officials point to weather and climate shifts as contributors. Wind events that funnel down mountain slopes — often called katabatic or, regionally, Santa Ana winds — have played a role in several of California’s largest recent blazes. These conditions, combined with prolonged dry spells, produced two of the state’s most damaging fires in early 2025.
Those incidents, together with an updated fire hazard map that took effect in July 2025, have changed obligations for homeowners and businesses. Newly drawn severity zones carry practical consequences — from construction requirements to insurance and vegetation management — and they do not always follow clear geographic lines on paper.
That confusion is precisely where the Simtable has shown value. By turning colored zones into animated scenarios, operators can demonstrate why one property sits inside a high-risk area while a neighbor’s does not — and what mitigation measures might reduce that risk.
What residents and officials should take away
Simulation tools do not replace boots on the ground or the need for investment in vegetation management, emergency planning and resilient building practices. But they provide a tangible bridge between scientific data and the daily choices that determine safety.
For homeowners in wildfire-prone regions, the practical implications are clear:
- Understand which zone your property is in and why it matters for construction and insurance.
- Engage with local demonstrations or request a visual briefing to see how fire could behave near your home.
- Prioritize defensible-space work and structural hardening where modeling shows greatest vulnerability.
As wildfires become more frequent and intense, tools like the Simtable offer emergency managers and communities a faster, clearer way to translate complex fire science into actionable steps — from on-the-ground tactics to neighborhood planning. For towns on the wildfire frontier, seeing the fire from above can change the decisions made on the ground.